
Business Case:
This case study is about a company named Blu which has successful ventures into multiple product ranges as well as leaders in real estate business. The company’s global business head wants to use a dashboard that helps to track key metrics about their nine business unit managers (executives), products, Sales, Quantities sold, and gross margins (GM).
Typically, the Extract-Load-Transform [ELT] process is being followed.
After Extracting and Loading the dataset, transform the data as per the requirement.
- Clean unused or erroneous rows [if there are any]
- Fixed the datatype issues [if any]
- Fix the other issues [if any]
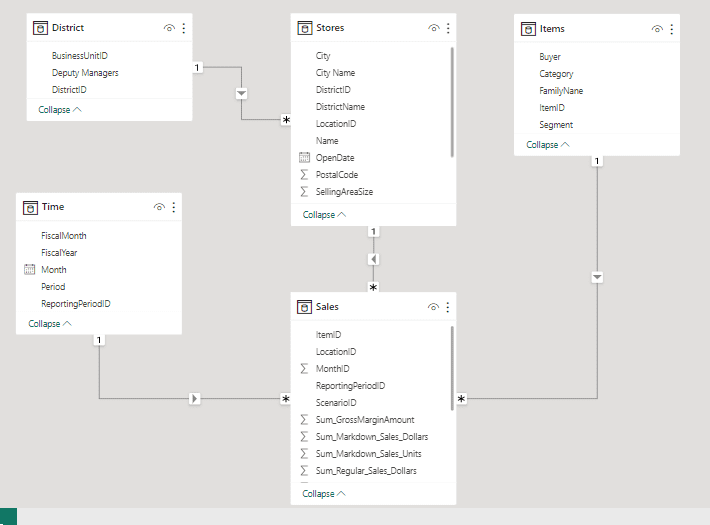
#2 – Data Modeling
As the database is normalized, we see lots of tables representing specific data points. At this point, having a proper relationship among the tables is of utmost importance.
Please create the relationship among the table if there isn’t any. The final schema should look as follows,
Revenue and Expense Analysis
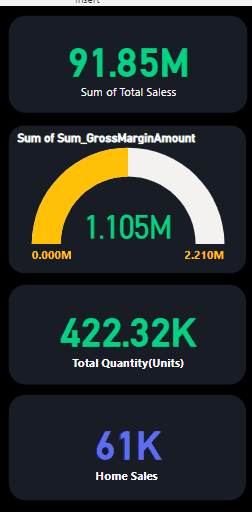
Total Sales is calculated using the below formula:
Total Sales = (Sum_Markdown_Sales_Dollars * Sum_Markdown_Sales_Units) + (Sum_Regular_Sales_Dollars * Sum_Regular_Sales_Units)
Total Quantity(Units) will be based on the summation of Sum_Markdown_Sales_Units and Sum_Regular_Sales_Units.
Management has an interest in analyzing the newly launched Home category for high-margin transactions. Home sales must be calculated for the total quantity sold for the Home Category with a gross margin greater than 10.
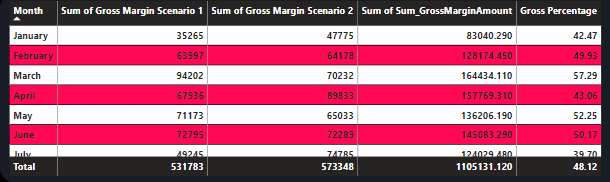
Create the following table chart, which shows
- Sum of Gross Margin for Scenario 1
- Sum of Gross Margin for Scenario 2
- Gross Percentage
All the calculations must be based on the Months of Sales datasheet.
Scenario 1 occurs when due to lesser inventory, all the ordered goods were not delivered to the customer.
Scenario 2 occurs when all the ordered goods were delivered to the customer, thanks to optimized inventory levels maintained.
Management wants to know that out of the total gross margin availed, what percentage is due to the transactions that occurred due to Scenario 1? Thus Gross Percentage is obtained by dividing the Gross Margin of Scenario 1 by the Sum of the Gross Margin Amount, subsequently multiplying with 100.
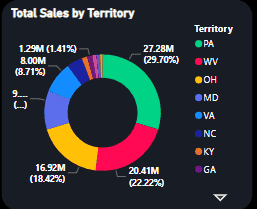
Plot Donut Chart to display the % contribution of Gross Margin and Total Gross Margin
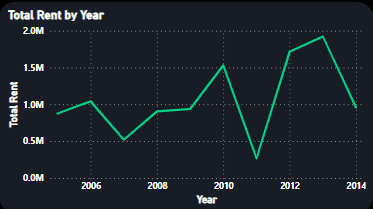
Create a drill-down capability to analyze Total rent obtained on a Time dimension
Questions and Findings
Q1. Based on Instruction
Blu wants to analyze the transactions that have gross that are not negative. Further analysis is needed on a Deputy Manager level.
For Deputy Managers named Andrew Ma and Brad Sutton, what is the total sales in Millions?
Answer:
The combined Total Sales for Andrew Ma and Brad Sutton is 24.82M.
Q2. Based on Instruction
Tags: Data Transformation, Data Modeling, Slicer, Filter, Data Visualization, DAX
Blu management is interested to know the highest total sales contribution in the top territory made by DMs Andrew Ma and Brad Sutton jointly. What is the right answer?
Answer:
The Highest Sales Contribution made by both Andrew Ma and Brad Sutton jointly is 11.69M and the top territory is PA.
Q3. Based on Instruction
Tags: Data Visualization, DAX, Data Formatting
To analyze the effect of probable loss of gross margins due to un-optimized inventory levels, Blue wants to know if there’s an immense need to maintain higher levels of Inventory. Maintaining higher levels of inventory can pose a serious risk to business due to piling up of unused stocks.
In the process, Management wants to know that out of total sales availed, what percentage sale is due to the highest territory sum of sales. Also to make the sales more robust, Management want to target the weak zone for this territory. For which territory the sales are the highest? Also Find the percentage contribution in sales due to this territory with respect to total sales. Analyze the lowest sales year for this territory along with the weakest Non-Zero Quarter in it.
Answer:
Out of the total sales amounting to 27.28 million, the highest territory sales accounted for 29.70%, and this contribution was matched by territory PA. The year 2007 marked the lowest sales for the territory, and during the same period, there was a Non-Zero Quarter. Q4.
Q4. After making the final dashboard
For the overall period during which stores have been opened, find out at which time (year, quarter, month) the lowest rent was generated and how much. (Note – You’ve considered only the quarter and months which are in the year having the lowest rent and having at least value greater than 0).
Answer:
The lowest rental income recorded was 25,237, and this occurred in the first quarter of 2013, specifically in March.
Q5. After making the final dashboard
The global business head is always looking to expand the business to various new industries in existing regions where penetration is low.
For territories WV, NC, OH, TN, and PA, what is the total number of units sold and out of it, how much are the units sold for the Juniors category?
Answers:
The total number of units sold in WV, NC, OH, TN, and PA territories is 327.85K.
The number of units sold for the Juniors category in the same territories is 29.19K.
I am thankful for the trust and support extended by Coding Invaders throughout this project. Their willingness to share resources and expertise has been a key factor in the project’s success.
Note* This Project is a part of my Data analyst course offered by Coding Invaders and I am sharing what I learned from my course.