
Business Case:
The Finance Department of ABC Company maintains the invoice level details of all Payroll vendors and the cost associated with generating payslips for their employees. The Analyst receives invoices for each vendor and he fills all the details from each invoice in an Excel sheet. He along with his colleagues collects similar data for all the countries and collates that information in one spreadsheet. The Global Finance leader along with other Country-level Finance leaders seeks data from these analysts to identify the Per Payslip Costs (PPC), that helps them in negotiating with vendors to reduce overall cost for the company.
Problem Statement:
Since data is being captured for different regions by separate analysts there is no way the Global leader could view the real-time global metrics, he has to wait for all the Country/Region-specific leaders to share their metrics with him and it only happens once a month. Your manager has got a request to build a global dashboard with some key metrics, that can be one source of truth for all regions. Your manager has assigned this task to you to collate all the Region-specific sheets in one file, clean all unwanted data map it with the other master tables, and create an automated dashboard solution that can serve all.
Dataset Description:
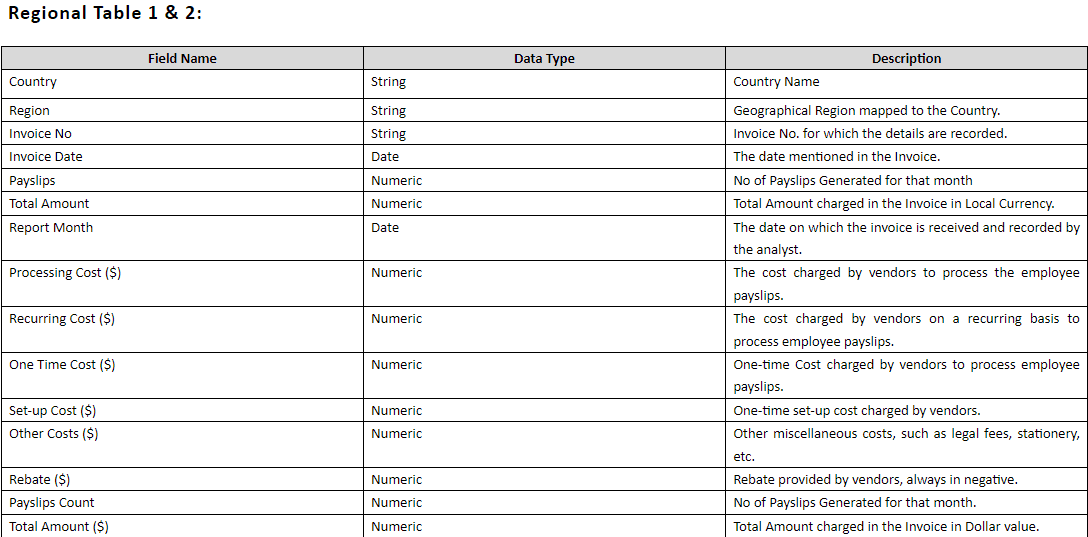
Country-wise Detailed information on Vendor Charges/fees( Regional Table1, Regional Table2)
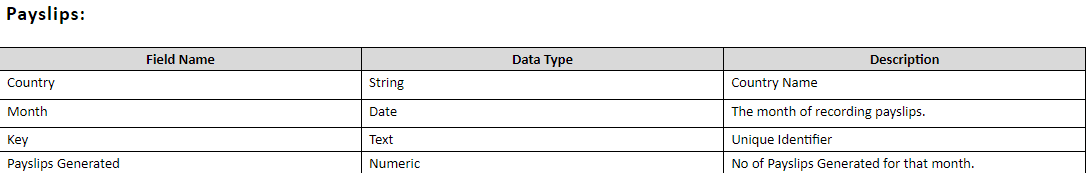
Country-wise Payslip Information(Payslips).
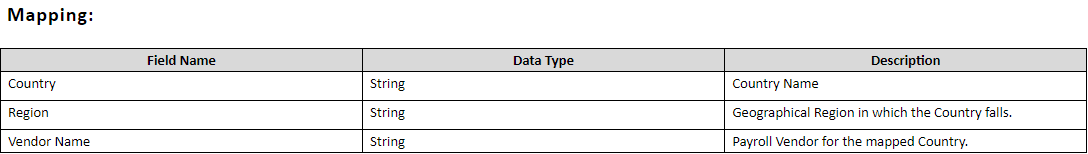
Master Mapping table – Country – Region – Vendor Name(Mapping).
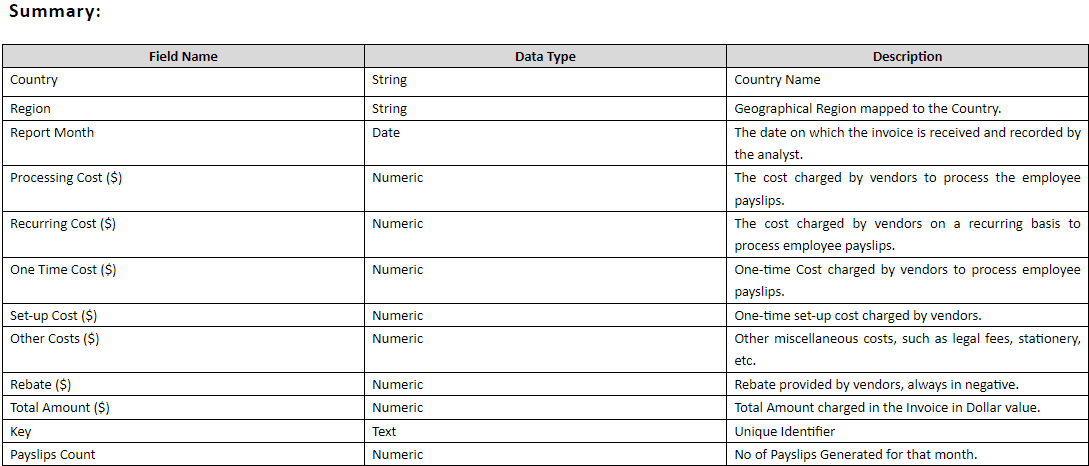
Summary Table consists of a Monthly summary of cost as well as payslip information.
Data Cleaning and Transformation:
- I right-clicked on the tables and selected “Rename” to give them names that matched the names in the Dataset worksheet.
- Next, I clicked on the first row of each table and selected “Remove Rows” from the top panel, then chose “Remove blank rows” from the drop-down list. This helped eliminate any blank rows.
- I also clicked on the first column of each table and selected “Remove Columns” to get rid of the first column, which wasn’t needed.
- To ensure that the first row became the headers, I clicked on “Use the First row as Headers” for each table.
- I repeated these steps for all the tables, ensuring that they were consistently cleaned and formatted.
- Finally, I clicked on “Close and Apply” in the editor window to save these changes.
In the Power Query view, here’s how I combined the Regional Invoice details tables into one Main Table and performed basic cleaning steps:
- Combine Regional Invoice Tables:
- In the Power Query Editor, I selected the first Regional Invoice details table.
- Then, I went to the “Home” tab and clicked on “Append Queries.”
- From the drop-down menu, I chose “Append Queries as New.”
- I repeated this process for the second Regional table, appending it to the first one.
- Rename the Combined Table:
- After appending both tables, I right-clicked on the combined table in the Queries pane and selected “Rename.”
- I named it “Main Table” as per your instruction.
- Replace Blanks/Nulls with 0:
- I selected all the columns that contained numeric values.
- Then, I went to the “Transform” tab and clicked on “Replace Values.”
- In the dialog box, I entered “null” (without quotes) in the “Value To Find” field and “0” (without quotes) in the “Replace With” field.
- I applied this operation to replace all blanks/nulls with 0 in the selected columns.
- Basic Cleaning Steps:
- To ensure consistent formatting, I selected all the numeric columns.
- Then, I went to the “Transform” tab and chose “Fixed Decimal Number.“
- In the dialog box, I set the decimal places to 2.
- Replace Null Values in All Columns:
- I performed a similar operation to replace null values with 0 in all columns, not just numeric ones.
- I selected all columns, went to the “Transform” tab, and clicked on “Replace Values.”
- In the dialog box, I again entered “null” (without quotes) in the “Value To Find” field and “0” (without quotes) in the “Replace With” field.
These steps helped ensure that the Main Table had consistent formatting, with blanks and nulls replaced by 0 in numeric fields, and null values replaced by 0 in all columns.
In the Data Model View, I ensured that the connections between tables were correct, specifically connecting the Mapping table to the Summary table, Payslips table, and Main table using the ‘Country‘ field as the key. This ensures proper data relationships and accurate analysis.
Live Dashboard
Key Findings:
- Germany has the highest count of Invoices.
- Count of Invoices for Singapore 134
- highest Invoice amount USA
- Total Amount for the Base month (in Millions) is 248.59M
- Per Payslip Cost (PPC) for India is 395.23
- Xcs Corp & ABF Inc. are the two top Vendors with a share of 91.09% both
- Total Processing Cost for the Month of March 2020 for LATAM is 10378127
- The payslip count for Canada in Dec 2020 is 609460 or 0.61 M(million)
- Except for 1 vendor ATL Corp, all the other vendors are catering to more than 1 country and there is a significant variance in the Average PPC values. The highest scope for negotiation lies for Xcs Corp & ABF Inc
Recommendations:
- DFG Corp has a presence in Morocco, Greece, and Russia, but there’s no amount or payslip information available for Greece and Russia.
- PPC is Total Amount/Payslip Count so either we have to reduce the amount or increase the Payslip count in order to reduce PPC. It can be reduced if we add more headcount to the country as more headcount means more payslips generated and the vendor.
Conclusion:
By consolidating data from different regions into a single Main Table and creating a unified dashboard, ABC Company can achieve several key benefits:
- Real-time Visibility: The global dashboard provides real-time access to crucial payroll cost metrics, eliminating the need to wait for monthly updates from individual regions. This ensures that finance leaders have up-to-date information at their fingertips.
- Transparency: The dashboard promotes transparency by offering a single source of truth for all regions. This not only reduces the risk of data discrepancies but also fosters trust among stakeholders.
- Efficiency: The automated data collection and visualization process enhances efficiency. Analysts can now focus on analysis and decision-making rather than manual data entry and reporting.
- Cost Reduction: Access to accurate and timely data allows ABC Company to negotiate effectively with vendors, potentially reducing the overall cost of generating payslips.
In conclusion, the implementation of a global payroll cost dashboard represents a significant step toward improving efficiency, transparency, and cost-effectiveness within ABC Company’s finance department. By centralizing data and providing real-time insights, the company is better positioned to make informed decisions and drive financial growth. This solution not only addresses the current challenges but also sets the stage for enhanced financial management in the future.
I am thankful for the trust and support extended by Coding Invaders throughout this project. Their willingness to share resources and expertise has been a key factor in the project’s success.
Note* This Project is a part of my Data analyst course offered by Coding Invaders and I am sharing what I learned from my course.