Buckle up as I guide you through the conceptualization and development of a dynamic Car Sales Dashboard using Power BI – a game-changer in understanding and improving sales performance.
The Drive Behind Car Sales DashboardDecision
Background: In a world where selling cars goes beyond showcasing sleek vehicles, Car dealerships identified the need for a robust analytics tool.
To meet this challenge head-on, we committed to creating a comprehensive Car Sales Dashboard in Power BI. This dashboard offers real-time insights into key performance indicators (KPIs), providing a deeper understanding of sales data.
Objective: The mission is clear – to design and develop a dynamic and interactive Car Sales Dashboard that goes beyond conventional reporting. This dashboard aims to visualize critical KPIs, empowering us to make well-informed, data-driven decisions and propel growth.
Unveiling the Key Performance Indicators (KPIs)
Problem Statement 1: KPI’s Requirement
DAX USED IN THE PROJECT
Calendar
1. Sales Overview: The heartbeat lies in sales, and the dashboard will provide a snapshot of our performance with metrics like Year-to-Date (YTD) Total Sales, Month-to-Date (MTD) Total Sales, Year-over-Year (YOY) Growth in Total Sales, and the Difference between YTD Sales and Previous Year-to-Date (PTYD) Sales.
Sales Measures
2. Average Price Analysis: Understanding the pricing landscape is crucial. The dashboard will delve into YTD and MTD Average Prices, YOY Growth in Average Prices, and the Difference between YTD Average Prices and PTYD Average Prices.
Average Price Measures
3. Cars Sold Metrics: A dealership’s success is measured by the number of cars driven off the lot. The dashboard will track YTD and MTD Cars Sold, YOY Growth in Cars Sold, and the Difference between YTD Cars Sold and PTYD Cars Sold.
Car sold Measures
Visualizing Car Sales Dashboard
Problem Statement 2: Charts Requirement
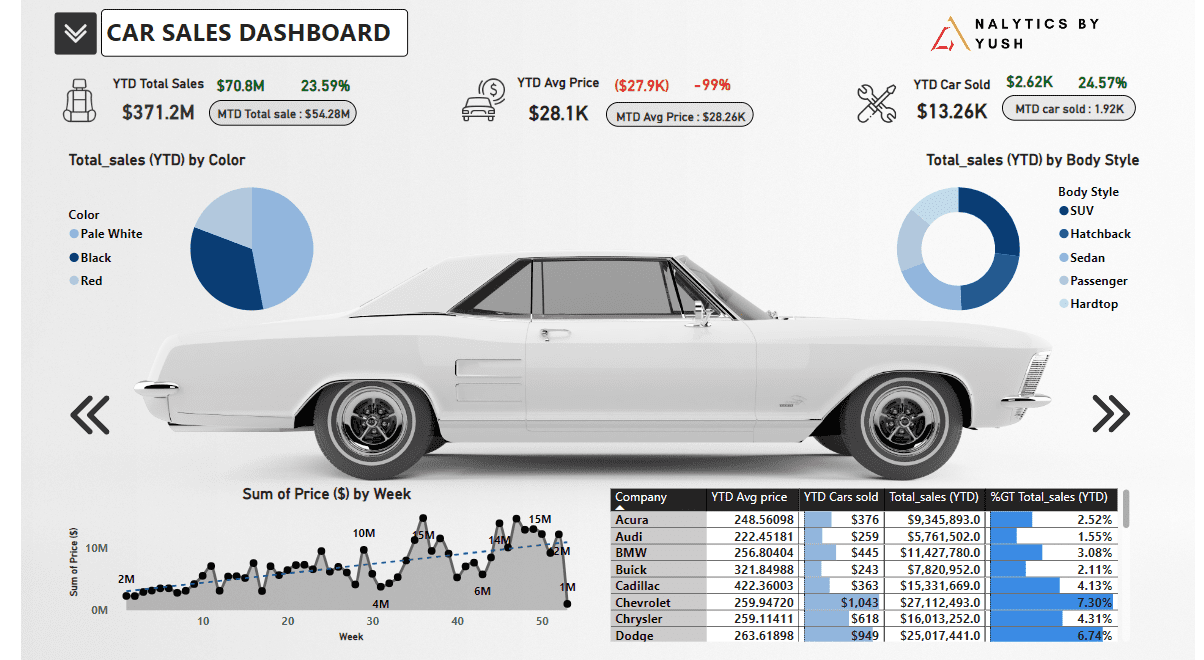
1. YTD Sales Weekly Trend: A dynamic line chart will illustrate the weekly trend of YTD sales. With the X-axis representing weeks and the Y-axis showing total sales amounts, this chart will provide a visual journey through the sales landscape.
2. YTD Total Sales by Body Style: Understanding the popularity of different car body styles is key. A vibrant Pie chart will visualize the distribution of YTD total sales, offering insights into customer preferences.
3. YTD Total Sales by Color: Colors can significantly influence buying decisions. A captivating Pie chart will present the contribution of various car colors to YTD total sales, helping us identify trends in color preferences.
4. Company-Wise Sales Trend in Grid Form: For a more granular view, a tabular grid will display the sales trend for each company. Simulated company names alongside their YTD sales figures will offer a detailed breakdown of individual performance.
5. Details Grid Showing All Car Sales Information: Complete transparency is key to making informed decisions. A detailed grid will present all relevant information for each car sale, including details such as car model, body style, color, sales amount, dealer region, and date.
Acknowledging Inspiration and Collaboration
Special gratitude is extended to Swapnjeet S from Data Tutorial, whose insights and inspiration significantly contributed to the development of this project. Their expertise in data analytics and visualization has been invaluable in shaping the direction of the Car Sales Dashboard.
Conclusion: Driving into the Future
In conclusion, this ambitious project represents a significant leap forward in leveraging data analytics for sales success. The Power BI Car Sales Dashboard is not just a tool; it’s a strategic asset for dealerships.
While the data is simulated for this project, the skills and competencies demonstrated lay the foundation for real-world applications in data analytics and visualization.
As the automotive industry continues to evolve, the ability to harness data for actionable insights becomes increasingly vital.
This Car Sales Dashboard is not merely a dashboard; it’s a vision of the future, where data is the driving force behind every decision, and analytics is the roadmap to success.
Stay tuned for the unveiling of the Power BI Car Sales Dashboard – a testament to innovation, collaboration, and the power of data-driven excellence in the world of automotive sales. Buckle up for a data-powered journey into the future of car sales analytics!
I post blogs related to data analysis and project case studies. Click here